May 2024 Market Update

May 2024 Market Update

May 2024 monthly Utah real estate market update report

Welcome to our monthly snapshot of Utah's real estate market. From Park City to Southern Utah, we've taken a look at average selling prices, days on market and price per square foot to give you a pulse of current market demand and conditions. Want to know more about your neighborhood? Simply reply back to this email and I'll put together a custom report for your property or area. Now, let's take a look at Utah's market report for the past month.

APRIL 2024 COMPARED TO APRIL 2023
*Rolling 6 months, November 2023 – April 2024 vs. November 2022 – April 2023
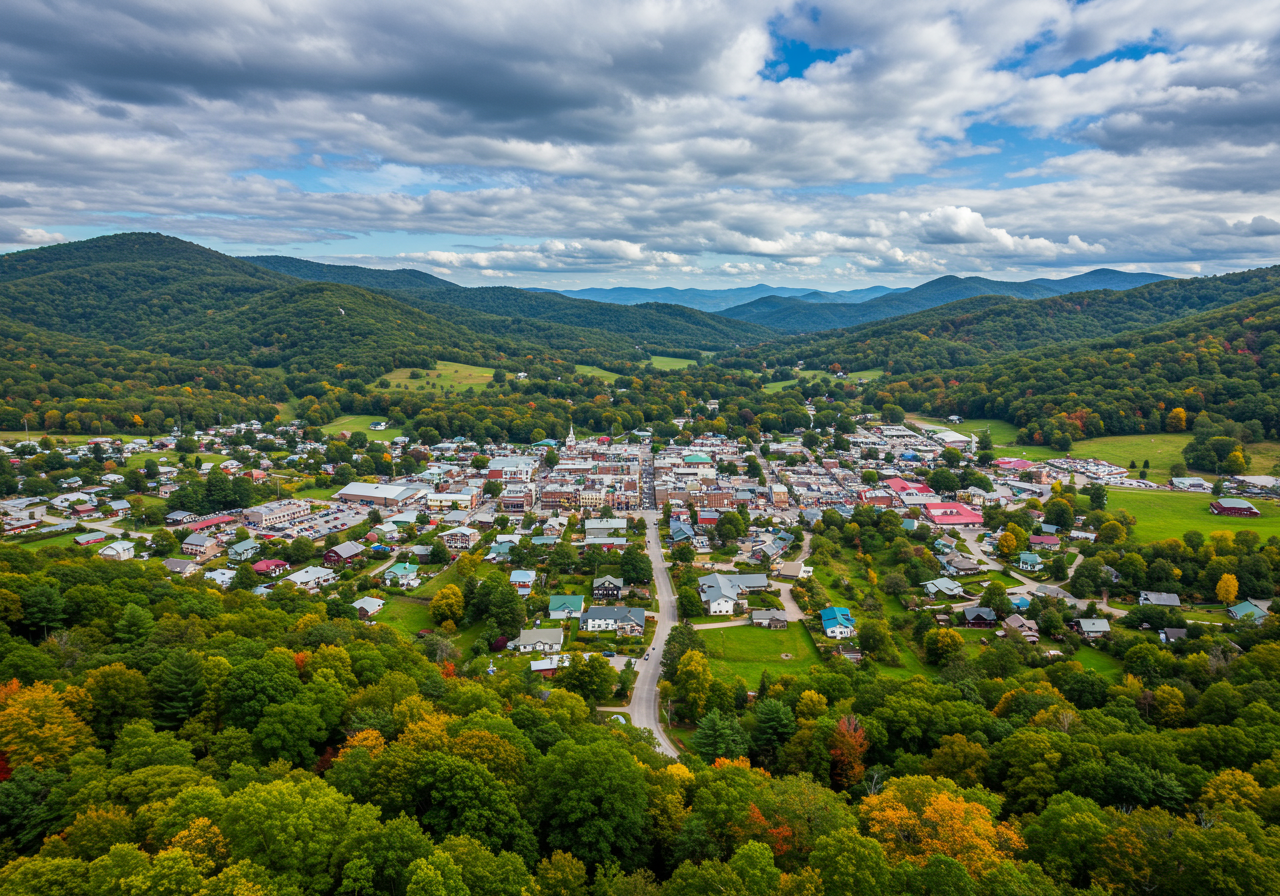
 
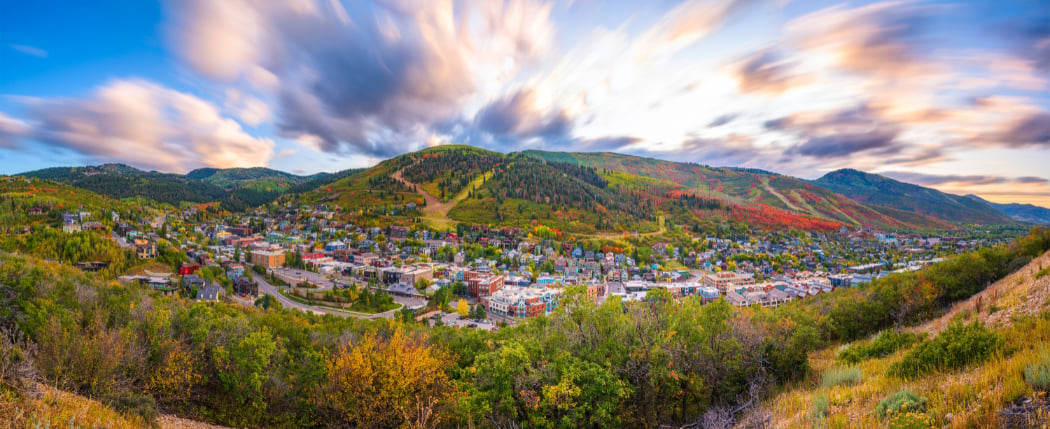
A mountain valley town surrounded by forested hills with early autumn colors beneath a cloudy sky.
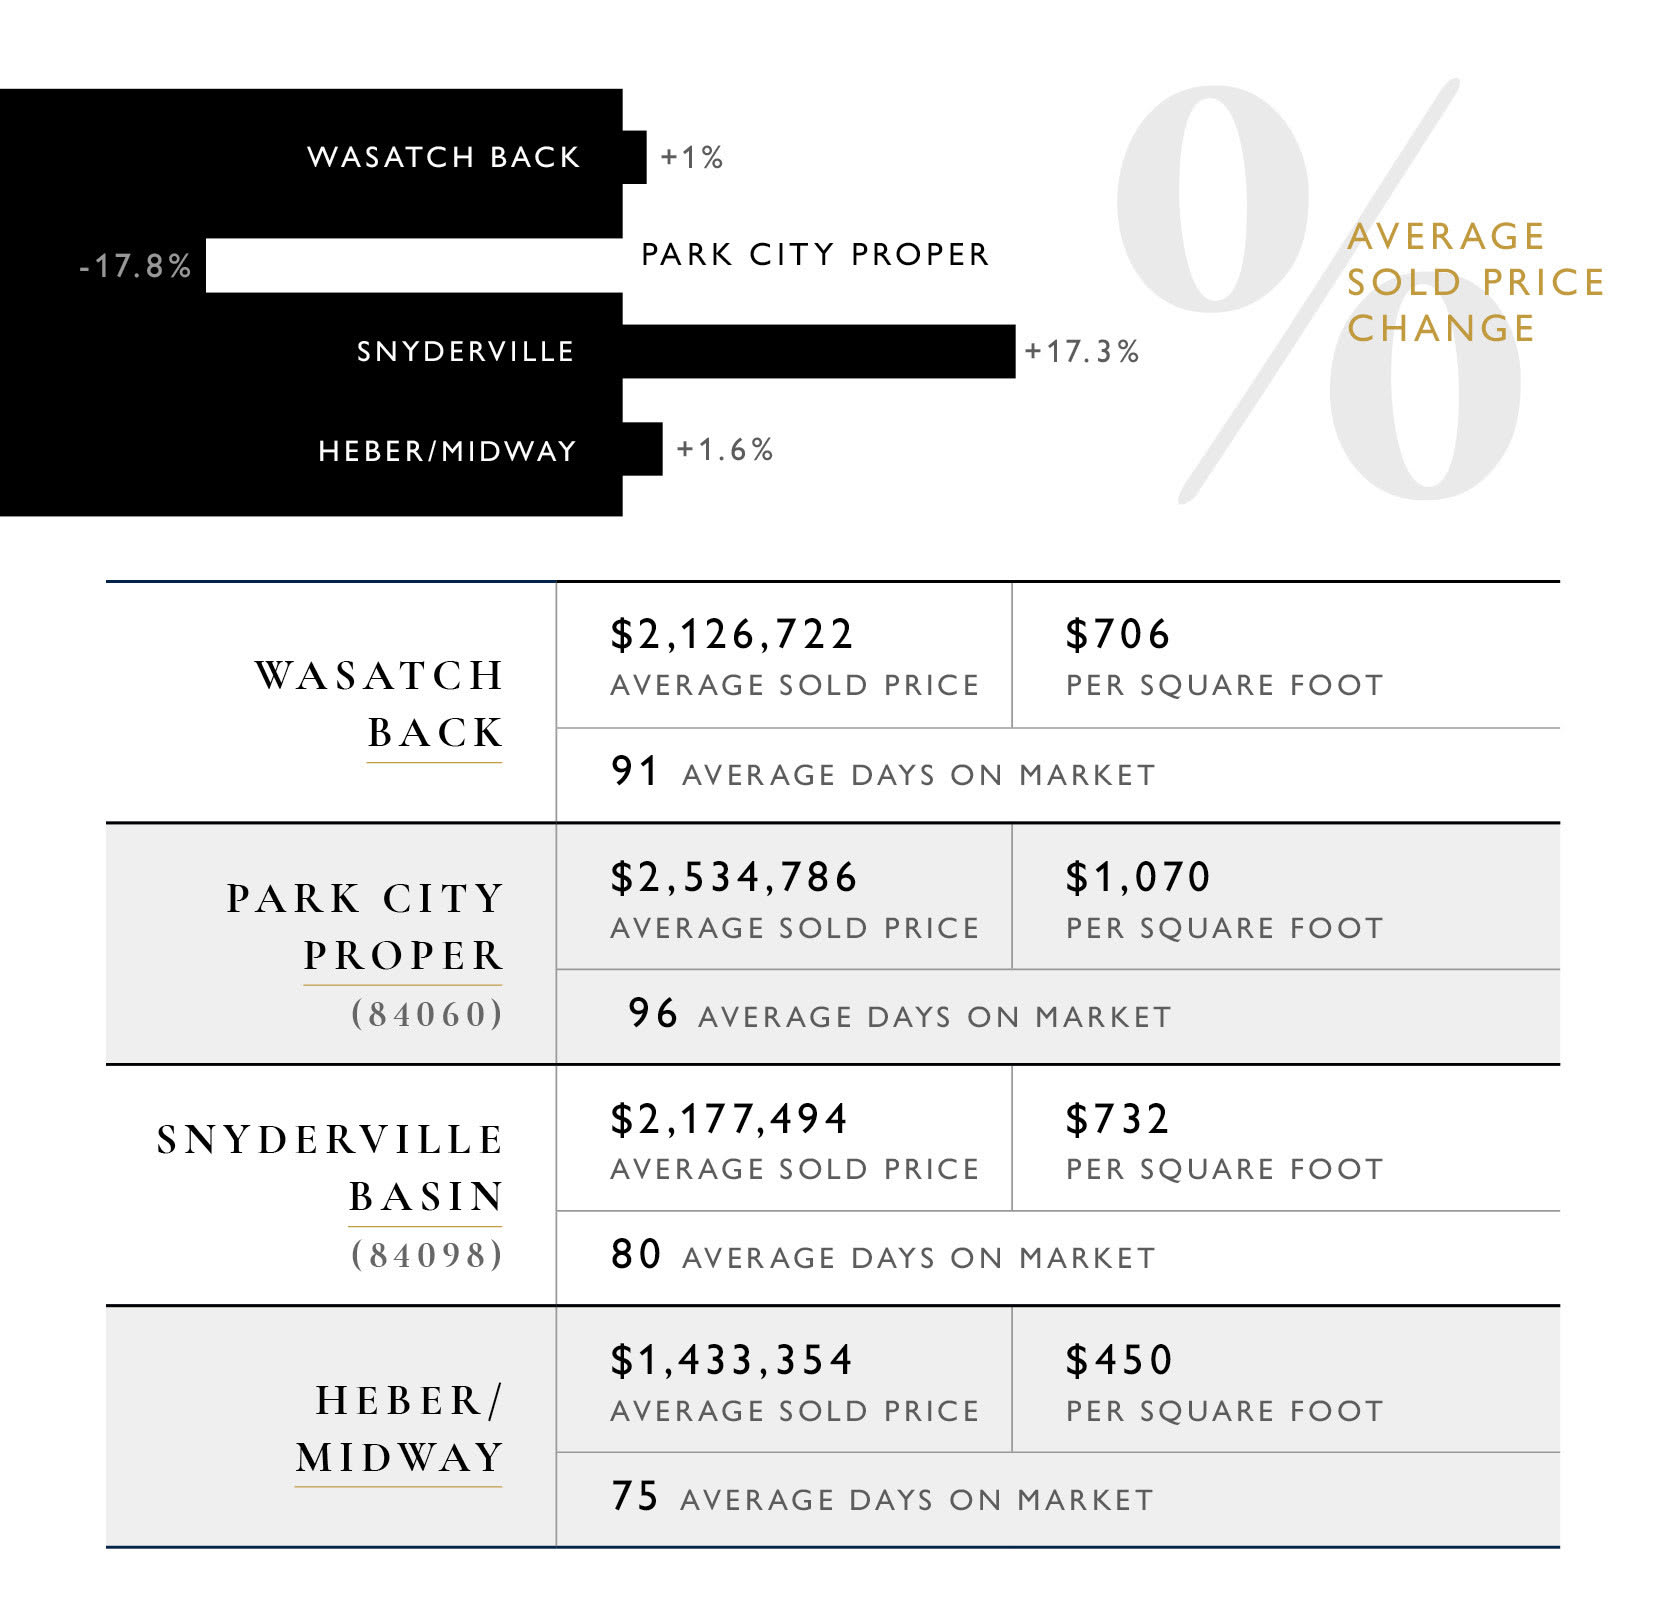
May 2024 Wasatch Back housing statistics: average sold prices, prices per square foot, days on market, and price changes by area.
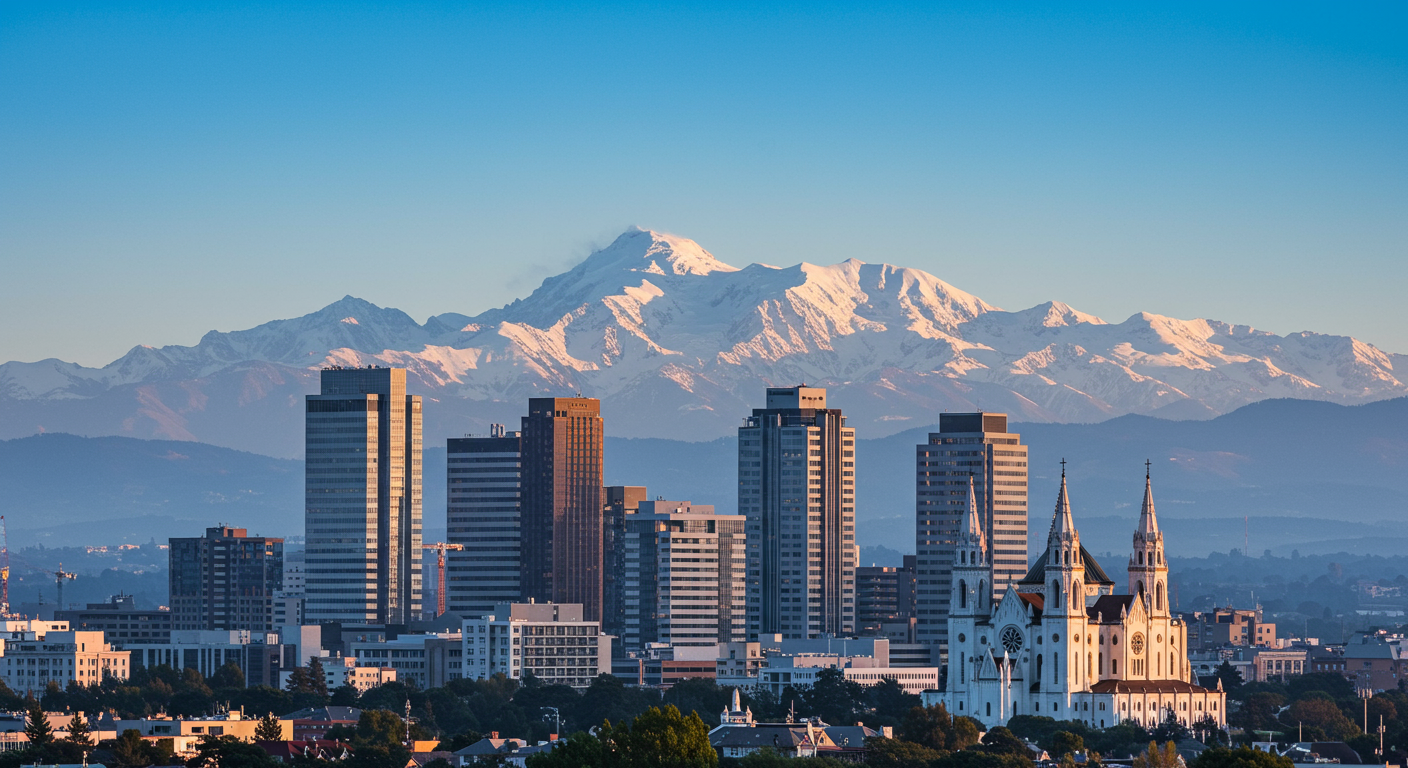
Salt Lake City skyline and Cathedral of the Madeleine beneath snow-covered Wasatch mountains.
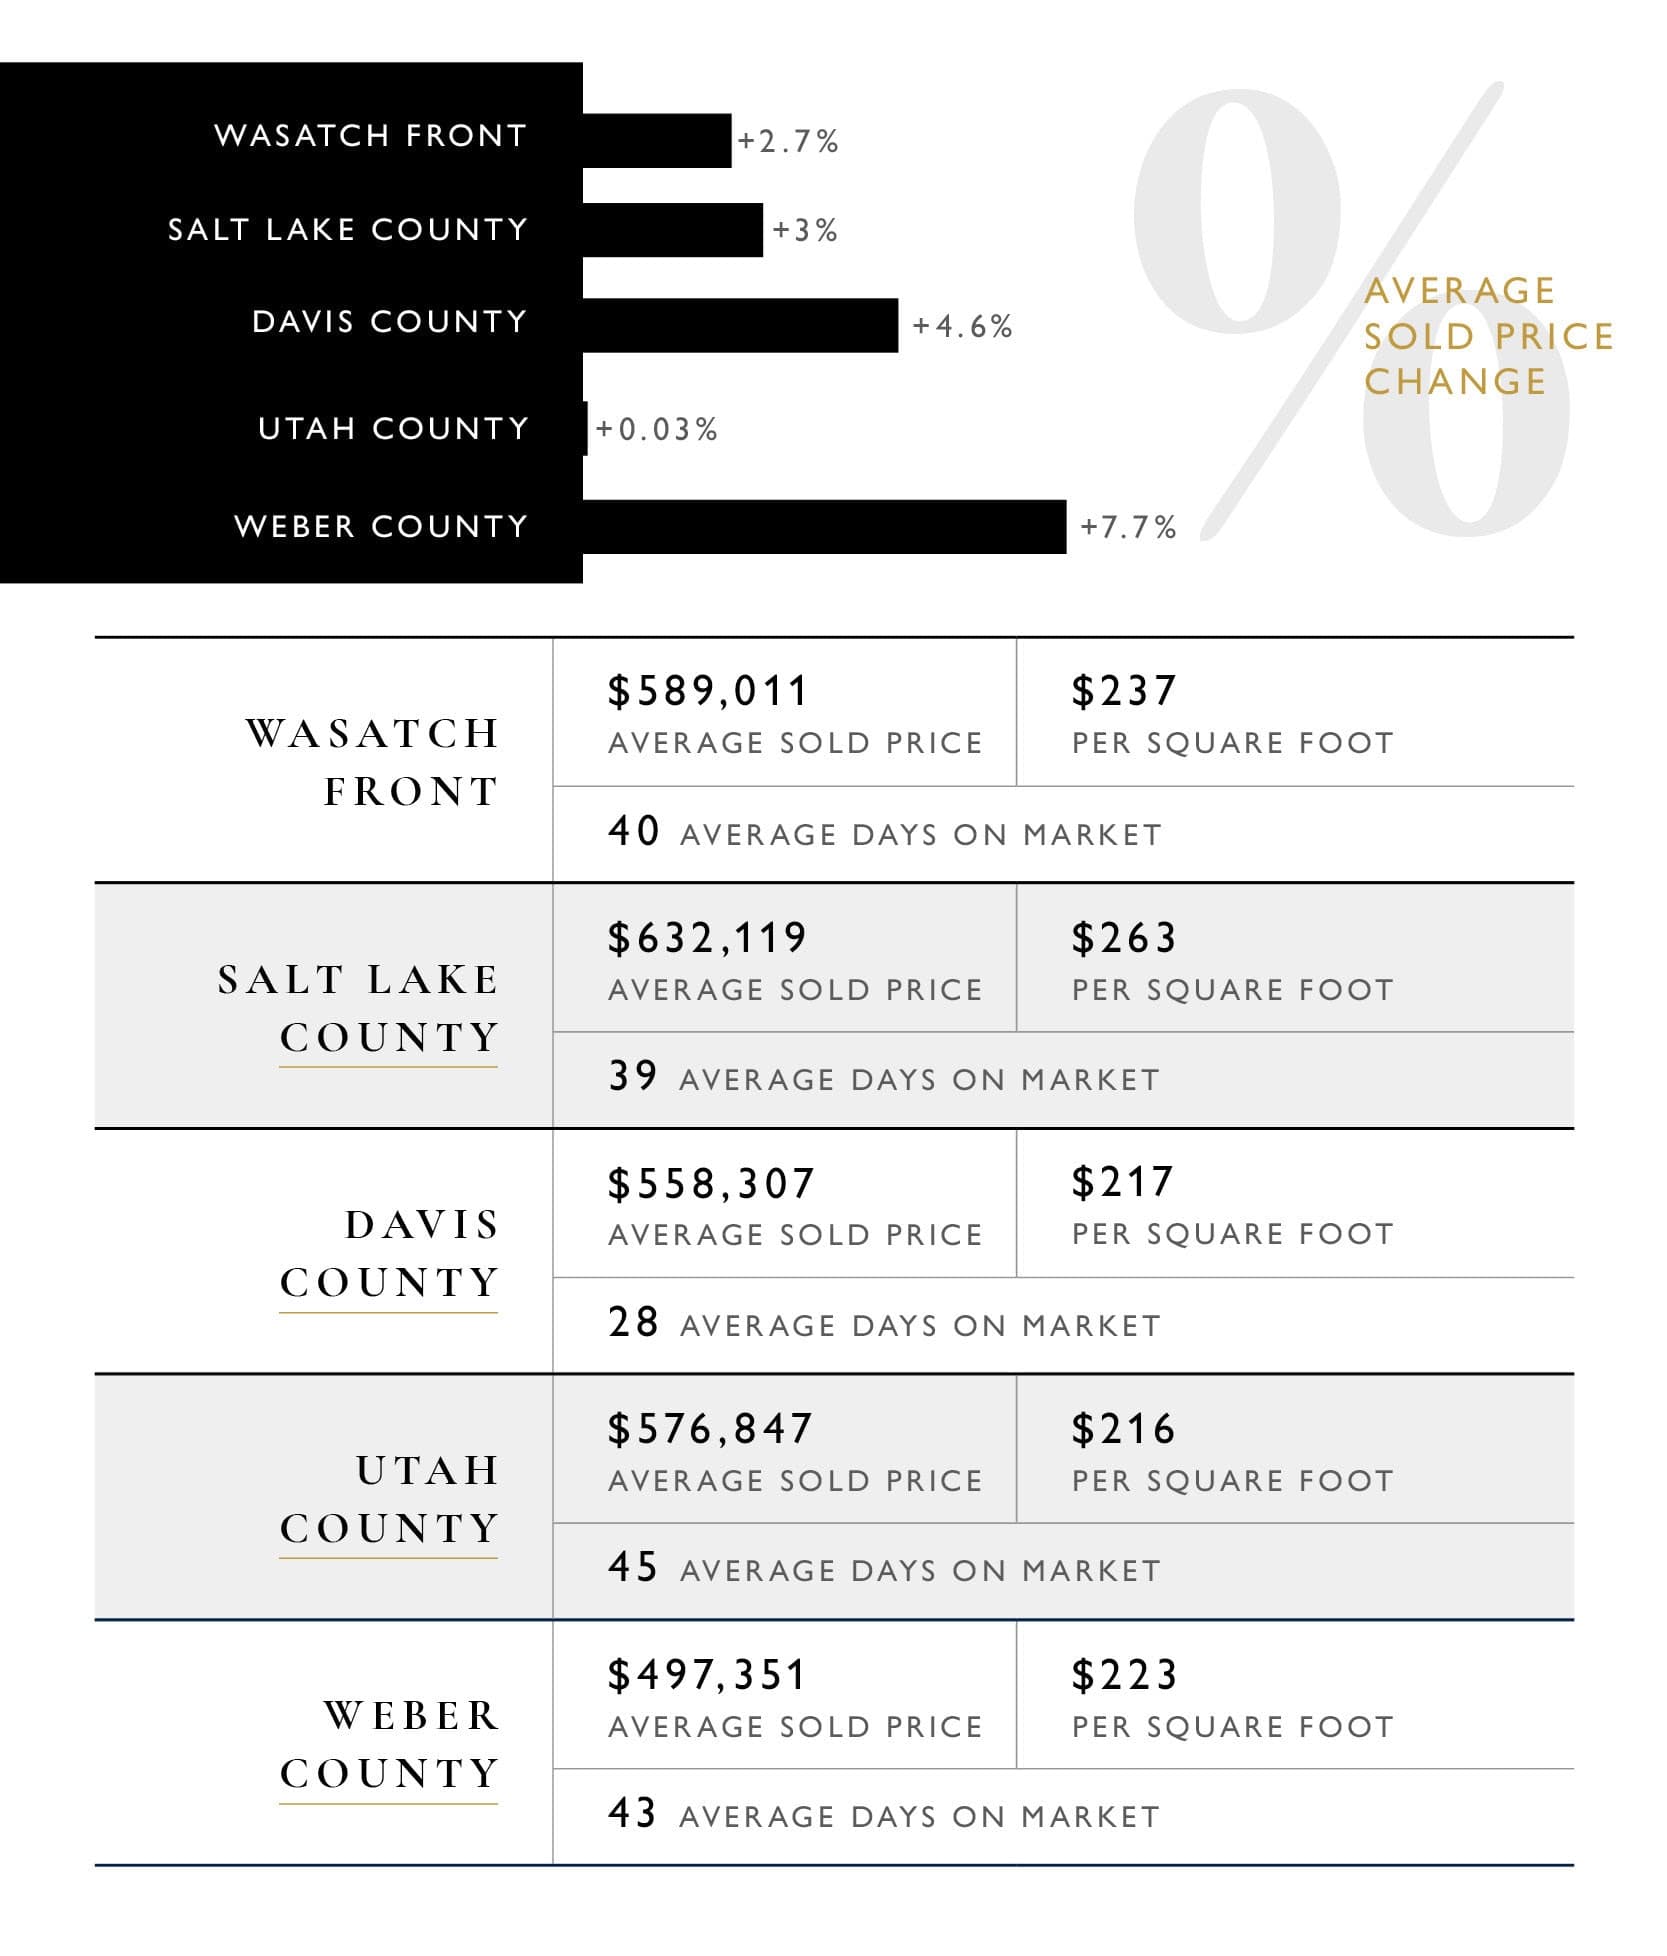
May 2024 Wasatch Front housing market infographic with county price changes, average sale prices, and days on market.
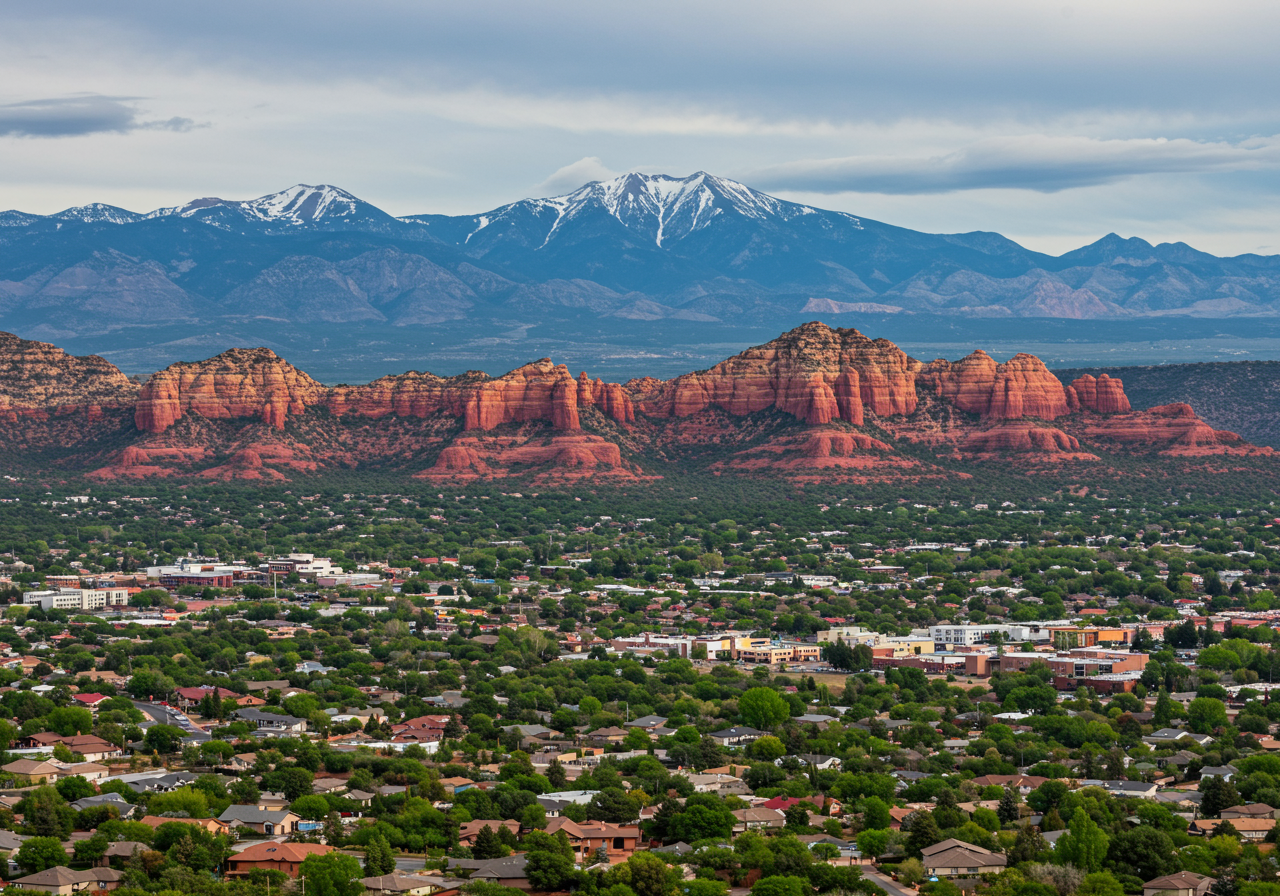
Town below red sandstone cliffs, with snow-streaked mountains in the distance.
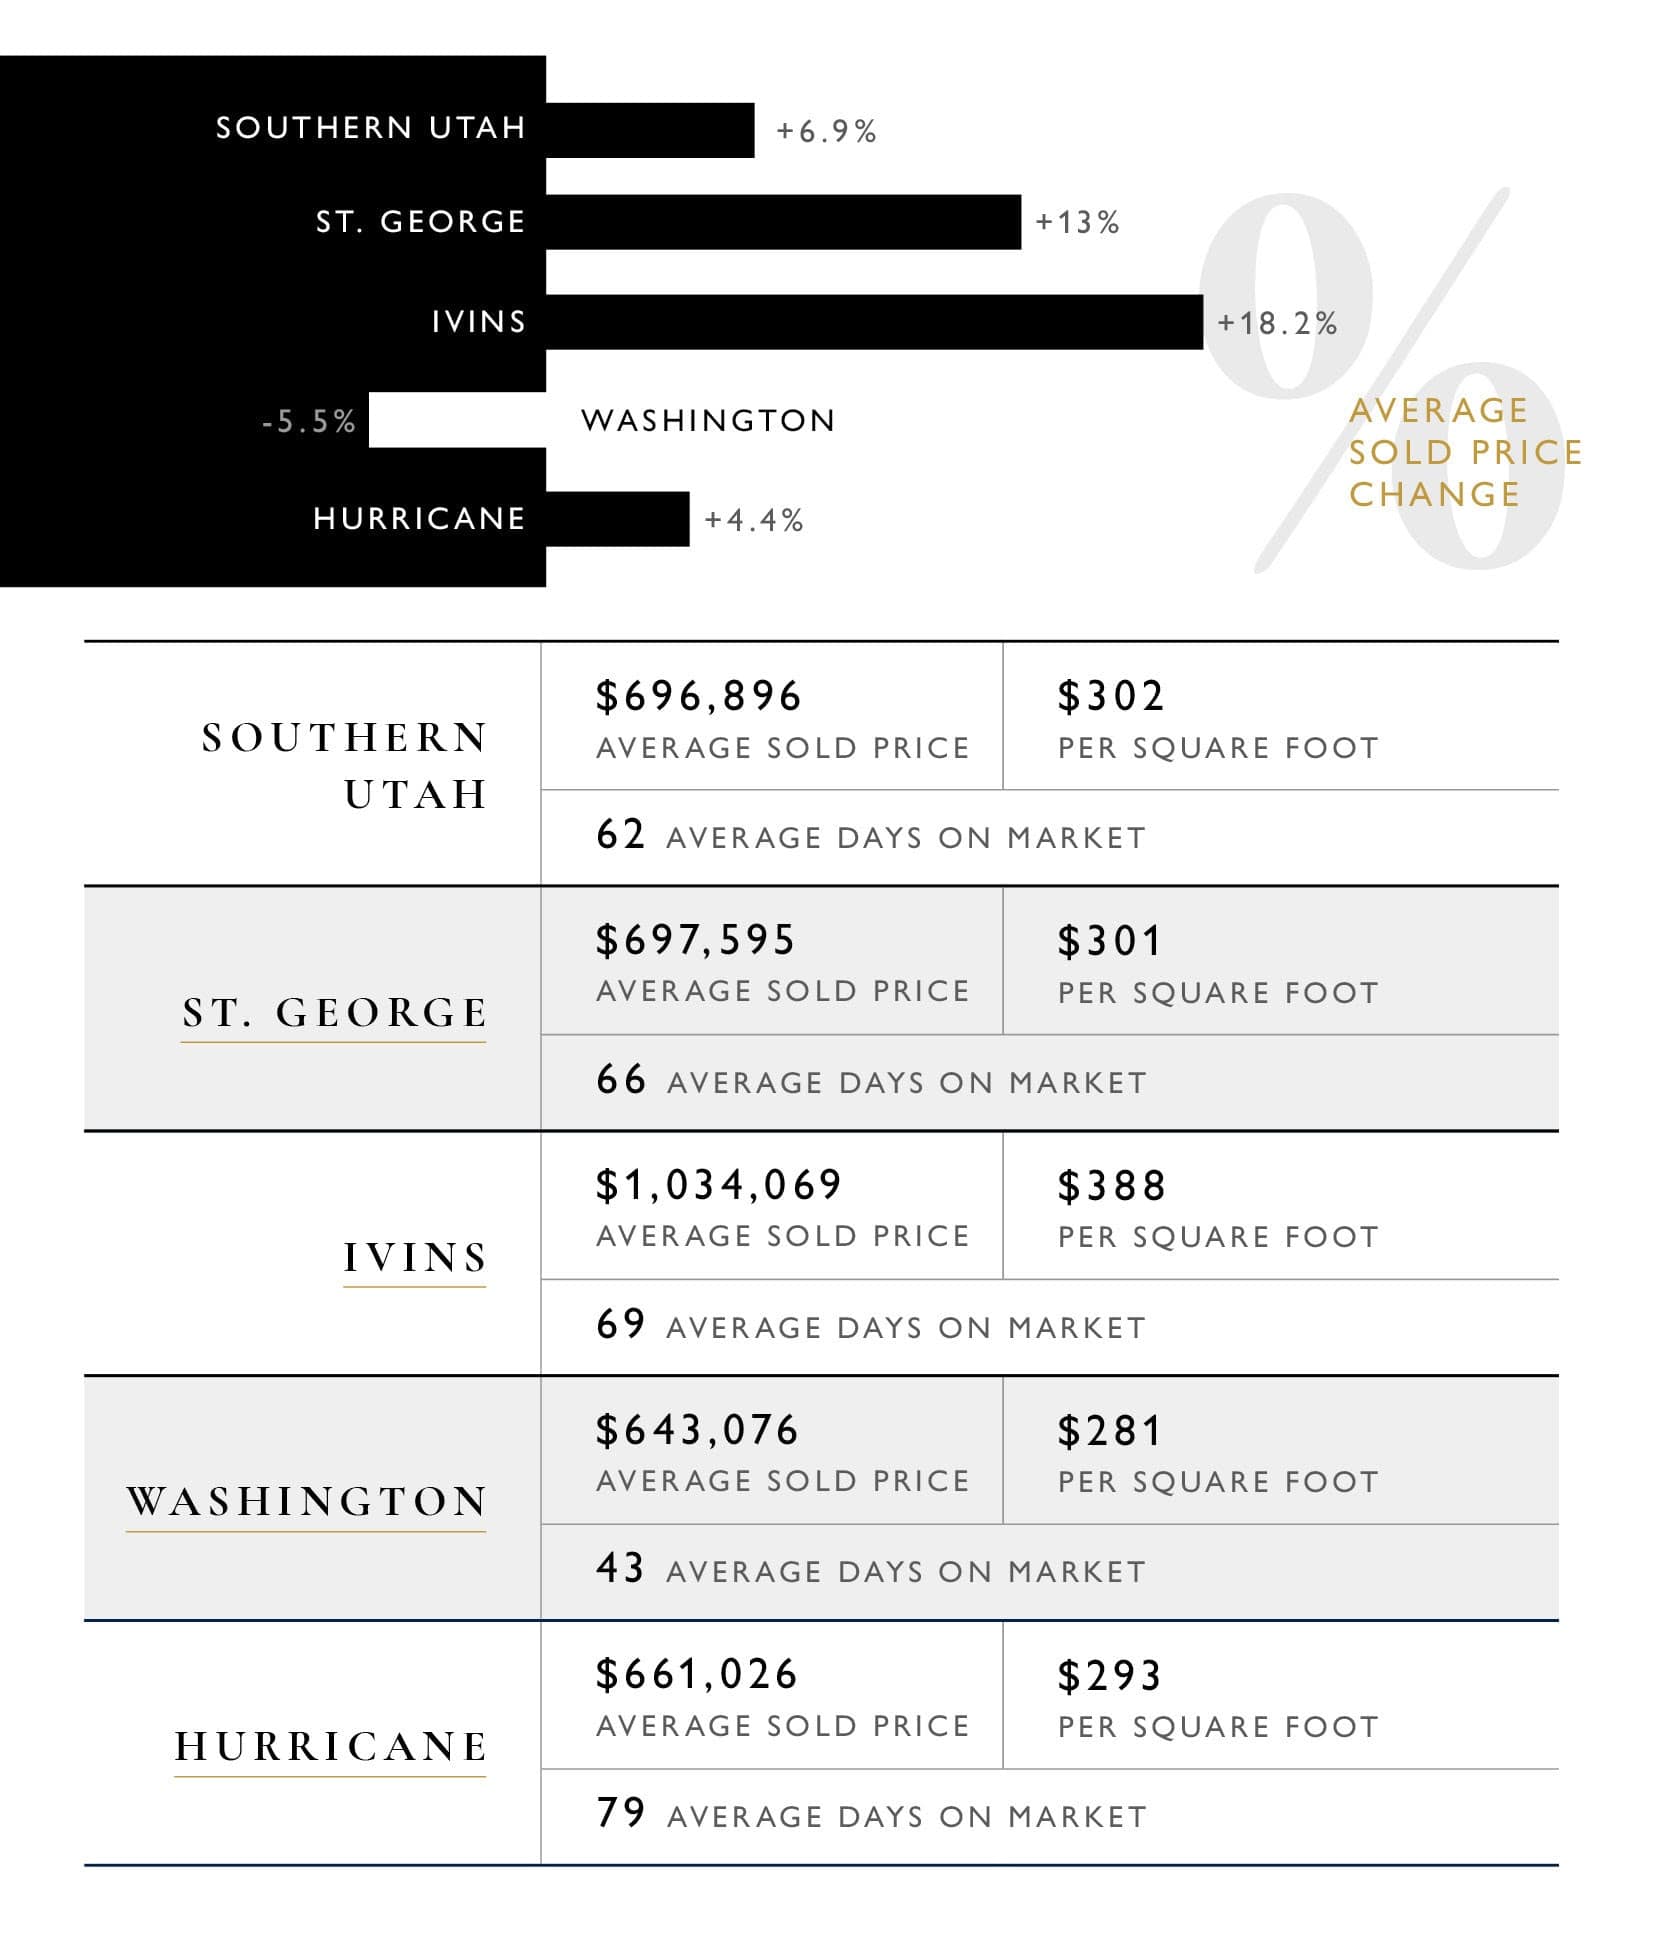
Southern Utah market infographic compares home price changes, average sale prices, price per square foot, and days on market.
Delicate Arch at sunset, framing distant mountains and a red sandstone desert landscape.
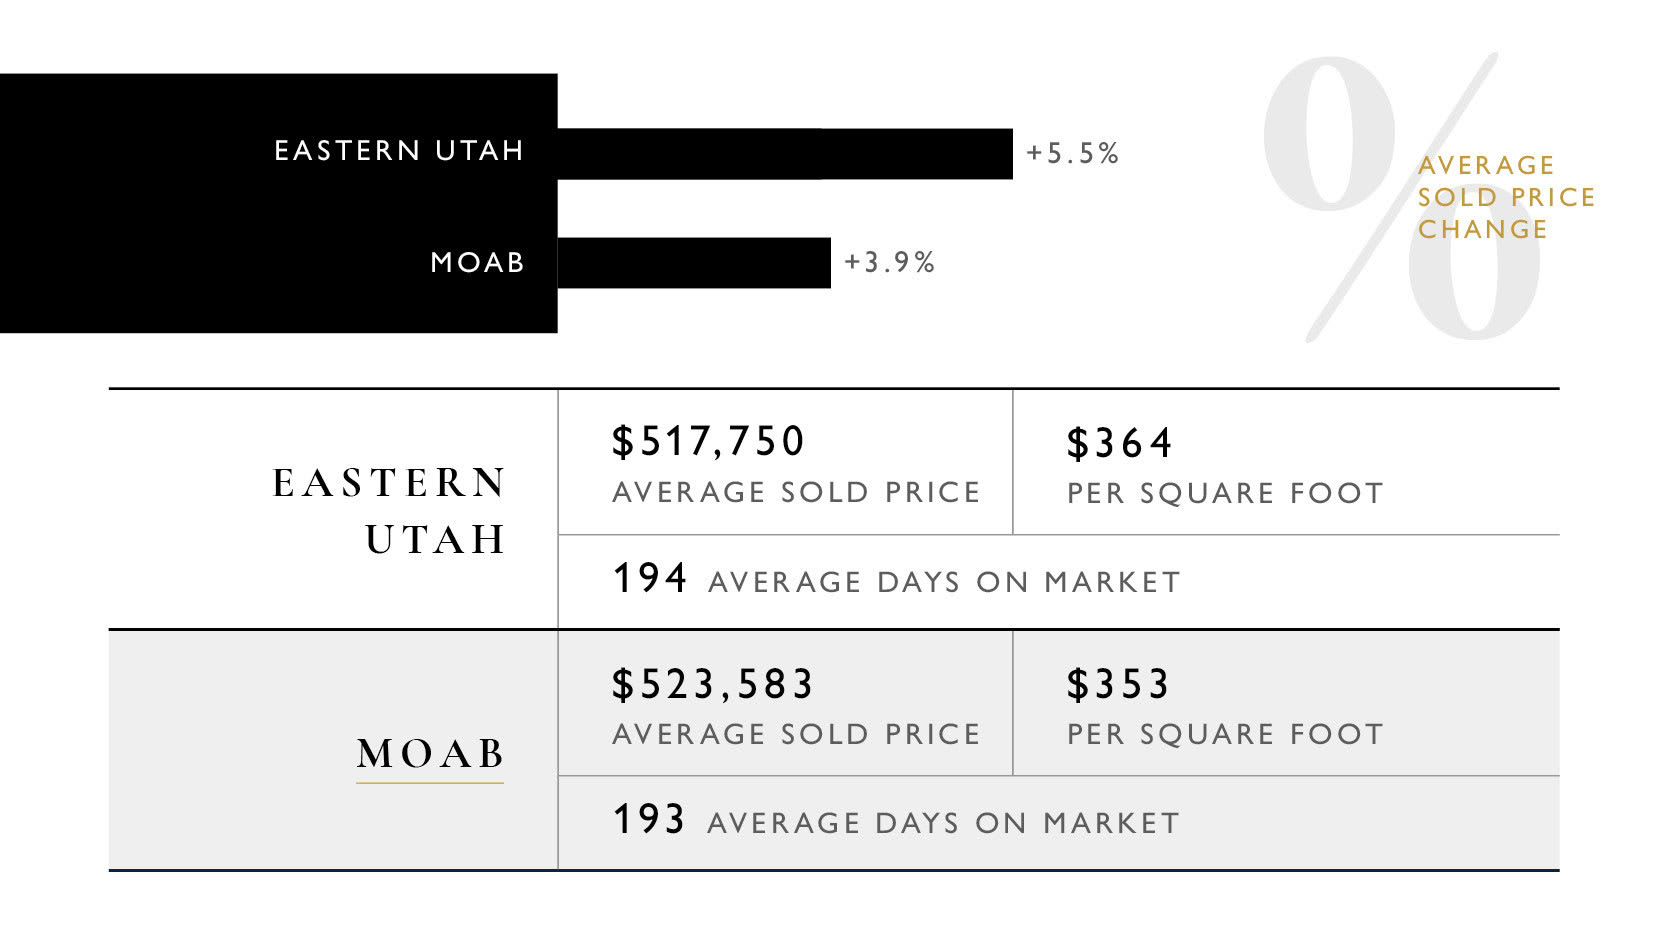
Eastern Utah and Moab market update with average prices, price per square foot, days on market, and price changes.
Based on information from the WFMLS, PCBAOR and WCMLS for the period November 1, 2022, through April 30, 2024. Information not verifiable by the WFMLS, PCBOAR or WCMLS. Prepared by Summit Sotheby’s International Realty.
 

Work With Us

Having dabbled in various fields of real estate over the years and juggling numerous high-demand projects and developments at once, Keri Holland and the team know the value of hard work, experience, and dedication. Connect with us today!

Follow Us on Instagram